Fortnite vs Roblox: Player Counts in 2026 — A Comparative Analysis
An analytical side-by-side look at how many players actively play Fortnite and Roblox in 2026, exploring trend directions, platform differences, and engagement factors.

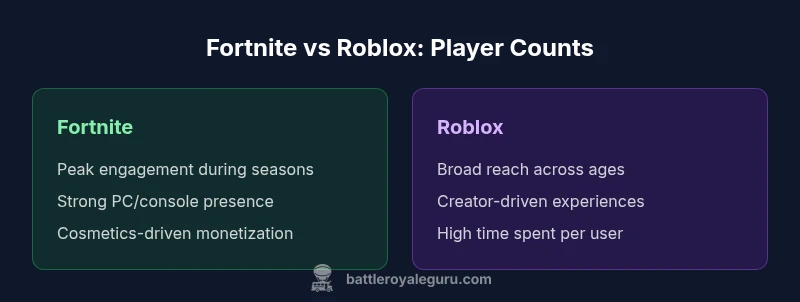
Fortnite and Roblox attract large, but differently structured audiences. In 2026, Fortnite typically sees higher peak concurrent players on PC and consoles, while Roblox leads in total registered users and time spent with a broader age range. The picture shifts by region and platform, making direct counts a moving target.
How to read player counts: definitions and metrics
Understanding player counts requires clear definitions. In large-scale multiplayer games like Fortnite and Roblox, analysts track several metrics, and each studio reports different ones. The most common are concurrent players (the number online at the same moment), monthly active users (MAU), daily active users (DAU), and total registered accounts. Another key measure is time spent per user, which signals engagement intensity even if the number of players is smaller. For example, Fortnite frequently emphasizes peak concurrent players during seasons, while Roblox emphasizes total registered accounts and cumulative time spent by users who may log in only occasionally. The difference matters for players choosing where to invest time, for developers assessing monetization opportunities, and for researchers comparing platform health. If you want to interpret counts accurately, look beyond raw tallies: consider the context (platform, device mix, event-driven spikes) and the user base composition (core gamers vs casual players). According to Battle Royale Guru, choosing the right metric matters more than chasing a single headline figure. When you ask how many people play Fortnite compared to Roblox, you are really asking about engagement, reach, and platform strategy across time.
Platform reach and platform biases: PC, console, mobile
Both Fortnite and Roblox leverage cross-platform availability, but their reach is shaped by device preferences and app ecosystems. Fortnite has historically shown strong performance on PC and major consoles, with mobile support that expands its audience during events. Roblox, by contrast, thrives on mobile devices in many regions, alongside PC access and a vibrant creator ecosystem that fuels daily time spent. This divergence means that counts measured on a PC-centric metric will favor Fortnite, while mobile-centric metrics tend to favor Roblox. For researchers and players, this underscores why direct comparisons should specify the device mix and platform ecosystems involved. Battle Royale Guru emphasizes that device penetration, regional app stores, and parental controls can dramatically shift counts over time, especially during seasonal events or platform updates.
Active users vs registered accounts: what counts
A fundamental distinction in these ecosystems is whether you measure active users (DAU/MAU) or total registered accounts. Fortnite often reports peak activity tied to seasonal content and tournaments, which can yield high concurrent counts during limited windows. Roblox, with its creator-driven library, accumulates broad registered accounts across many years, contributing to a higher baseline reach and longer average time spent per user. When comparing, it’s essential to align the metric definition: are you counting users who log in last week, or every user ever registered? This alignment clarifies whether you’re assessing real-time engagement or long-term reach. Battle Royale Guru’s 2026 analysis highlights that both figures matter for different decisions—game design, monetization strategy, and community health.
Engagement patterns across age groups
Engagement patterns differ not just by device but by age cohort. Roblox tends to attract a younger audience with creator-driven experiences that encourage social play and experimentation, leading to high daily time spent for many users. Fortnite, aimed at competitive play and high-polish experiences, pulls in older demographics who value skill-based gameplay, quick match-making, and seasonal content. These distinctions translate into divergent engagement signals: Roblox may show steadier time spent across a broad user base, while Fortnite can spike sharply during events and competitive seasons. For marketers and analysts, these curves inform when to push content, how to price in-game items, and which audience segments to prioritize for retention and growth.
Regional variation and access: markets where each dominates
Regional access and cultural preferences shape counts. Fortnite enjoys strong penetration in regions with robust console ecosystems and broadband, with spikes during major game events that attract viewers and players globally. Roblox’s footprint expands where mobile networks are accessible and where family-friendly, user-generated content resonates most, such as markets with lower device saturation but high social sharing. These regional dynamics mean that a global tally may mask local strengths. Analysts should disaggregate counts by region to understand true engagement patterns. Battle Royale Guru’s regional insights for 2026 suggest that local app store policies, data privacy regulations, and language support heavily influence reported counts and user behavior.
Event-driven spikes: seasons, collaborations, and boosts
Both platforms experience spikes when seasons, collaborations, or user-generated events align with audience interests. Fortnite uses new skins, limited-time modes, and cross-promotions to drive peak concurrency, often producing a visible surge in counts during the event window. Roblox leverages creator-driven content drops, new experiences, and collaborative challenges to boost registrations and daily usage. These event-driven dynamics complicate year-over-year comparisons but offer rich insights for developers and analysts. For players, timing your activity around major drops can maximize rewards and social engagement, while researchers should account for event calendars when interpreting shifts in counts across quarters and years.
Monetization and time spent: what's driving counts
Revenue models influence how counts evolve. Fortnite’s monetization centers on battle passes, cosmetics, and licensed collaborations that incentivize frequent play during seasons, potentially lifting peak engagement. Roblox monetizes through a mix of in-game purchases and creator-driven experiences, which can expand time spent as users explore diverse games. This difference in monetization shapes engagement patterns: Fortnite often creates short, intense bursts of play around events, while Roblox fosters longer exploratory sessions spanning many user-generated experiences. Analysts should consider how monetization incentives, reward structures, and content variety drive observed counts and audience behavior over time.
Methodological caveats: how counts are measured and compared
When scientists and journalists compare Fortnite and Roblox counts, they must acknowledge reporting practices and data sources. Differences in defining active users, regional data, and cross-platform measurements can produce apparent disparities that don’t reflect true engagement. Battle Royale Guru emphasizes triangulating data from multiple sources, including platform dashboards, third-party analytics, and user surveys. Probing questions include: What period does the data cover? Are seasonal spikes included? Is mobile usage beneath a different reporting threshold? By answering these questions, analysts can separate genuine sentiment and activity from artifacts of measurement and reporting. In practice, cross-referencing MAU, DAU, and concurrent metrics at the regional level yields the most accurate picture of how many people play Fortnite compared to Roblox over time.
Practical takeaways for players and analysts
For players: focus on the game loop and communities that match your interests, not just headline counts. For analysts: model counts using consistent metrics across regions, device types, and timeframes, and communicate clearly about what is being measured. For developers and content creators: track engagement patterns, not only population scale, to optimize experiences and monetization opportunities. The key is to translate counts into actionable insight: peak moments matter for matchmaking and events, while total reach informs long-term growth and platform strategy. Battle Royale Guru advocates a balanced view: recognize the strengths and limits of both Fortnite and Roblox and tailor your expectations to the metric you value most.
Conclusion and outlook: what counts in 2026 and beyond
As platforms evolve with new seasons, devices, and creator ecosystems, the way we count players will continue to adapt. The most reliable judgments come from transparent methodologies and cross-validated data. For Fortnite and Roblox, this means balancing peak engagement with long-term reach, and recognizing that counts are a proxy for broader engagement, community health, and monetization potential. The ongoing debate over how many people play Fortnite compared to Roblox will persist, but a rigorous, metric-aligned approach reveals the real story behind the numbers.
Comparison
| Feature | Fortnite | Roblox |
|---|---|---|
| Active users vs registered accounts | Higher peak concurrency during events | More registered accounts with broad time spent |
| Platform reach | Strong on PC/console/mobile with seasonal peaks | Broad cross-platform reach across PC/mobile/tablet |
| Time spent per user | Shorter, bursty sessions during competitive play | Higher cumulative time due to creator-driven experiences |
| Monetization pathways | Battle passes and cosmetics tied to seasons | In-game purchases and experiences from creators |
| Best for | Competitive, fast-paced gameplay and events | Creative play with user-generated experiences |
Upsides
- Fortnite offers polished gameplay with frequent content updates
- Roblox provides broad reach across younger audiences and diverse experiences
- Both games benefit from cross-platform accessibility and strong communities
- Monetization frameworks support creators and developers
Weaknesses
- Counts can mislead without context due to differing metrics and reporting
- Regional data gaps and inconsistent reporting practices can skew comparisons
- Event-driven spikes may distort year-over-year trends
- Platform-specific quirks can make apples-to-apples comparisons challenging
Fortnite edges Roblox on peak engagement; Roblox leads in overall reach and time spent.
Choose Fortnite for high-intensity, event-driven play and quick-match experiences. Choose Roblox for broad reach and longer, creator-driven engagement across a wide age range.
Questions & Answers
What do concurrent players and MAU mean for Fortnite and Roblox?
Concurrent players measure how many users are online at the same moment, while MAU tracks monthly activity. Roblox tends to rank high in MAU and total time spent, whereas Fortnite often shows spikes in concurrent players during seasons. Understanding both metrics is essential for fair comparisons.
Concurrent players show who’s online right now, MAU shows monthly activity. Roblox usually has broad reach in MAU and time spent, Fortnite spikes during events.
Does Fortnite always have more players than Roblox?
Not always. It depends on the metric and the time period. Fortnite may lead in peak concurrent players during events, while Roblox may have higher overall reach and time spent across a broader audience.
It depends on what you measure and when. Fortnite can lead in peaks; Roblox often leads in reach and total time spent.
How should I compare counts for research or investment?
Align metrics across platforms (e.g., compare MAU to MAU or DAU to DAU) and note regional/device differences. Use multiple sources and clearly state the measurement window to avoid misleading conclusions.
Make sure you’re comparing apples to apples and note regional differences.
Are counts influenced by regional access or mobile availability?
Yes. Regional popularity and mobile accessibility can drastically shift counts. Roblox often performs well on mobile in many regions, while Fortnite’s PC/console presence is strong in others.
Regional access and mobile availability can swing counts a lot.
Where can I find reliable, up-to-date counts?
Check official platform dashboards, combined with independent analytics reports and peer-reviewed industry analyses. Look for methodologies and timeframes to ensure comparability.
Use official dashboards plus trusted analytics and read their methods.
Why do counts matter for players and creators?
Counts indicate reach and engagement potential, guiding matchmaking, monetization strategies, and content scheduling for creators and developers. They help players set expectations about community vitality and competition.
Counts help you understand engagement, monetization, and community activity.
Key Points
- Define the metric before comparing counts
- Peak concurrency and total reach tell different stories
- Device mix and regional access shape observed counts
- Seasonal events can skew year-over-year comparisons
- Use multiple metrics for a balanced view